How much does solar cost?
System size, cost of energy, and leveraged IRR are all important variables in solar cost.
The importance of scale in solar PV installations
As the size of a solar PV installation increases, the associated costs are lowered.
Rooftops
| Large House (pitched roof, asphalt)  | Small office 10,000 sqft, flat roof 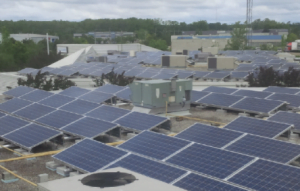 | Medium shop 22,000 sqft, flat roof  | Larger facility 35,000 sqft, flat roof 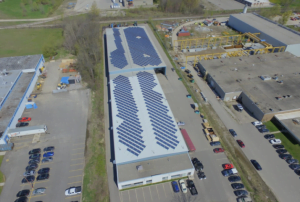 | Box store/Warehouse 50,000s sqft, flat roof  | |
| System size | 12.0kW (30 panels) | 75kW (180 panels) | 200kW (500 panels) | 350kW (875 panels) | 600kW (1620 panels) |
| Installed $/W | $3.00/Watt | $2.20/Watt | $1.75/Watt | $1.70/Watt | $1.60/Watt |
| System Cost | $36,000 | $165,000 | $350,000 | $595,000 | $960.000 |
| Electricity | $0.115/kWh | $0.136/kWh | $0.136/kWh | $0.136/kWh | $0.136/kWh |
| Annual Production | 13,000 kWh | 80,000 kWh | 225,000 kWh | 395,000 kWh | 680,000 kWh |
| Investment Horizon | 25 years | 25 years | 25 years | 25 years | 25 years |
| LCOE | $0.165/kWh | $0.105/kWh | $0.077/kWh | $0.074/kWh | $0.069/kWh |
| Payback | 23.0 years | 13.1 years | 10.1 years | 9.7 years | 9.1 years |
| Unleveraged IRR | 0.80% | 6.50% | 9.70% | 10.10% | 10.90% |
| Leveraged IRR after tax | n/a | 34.50% | 48.20% | 50.10% | 53.40% |
These figures are representative of high performance sites, pricing as of November 2020 and subject to change.
Solar Carports
| Parking lot spaces (vehicles) | 8 parking spaces  | 20 parking spaces  | 60 parking spaces  | 100 parking spaces 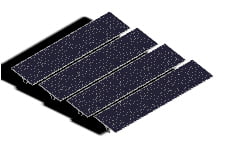 | 200 parking spaces  | 400 parking spaces 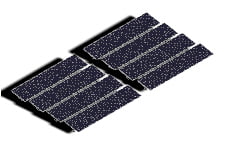 |
| System size | 38kW | 96kW | 288kW | 480kW | 960 | 1,920kW |
| Installed $/W | $3.50 | $3.10 | $2.80 | $2.65 | $2.55 | $2.50 |
| System cost | $134,400 | $297,600 | $806,400 | $1,272,000 | $2,448,000 | $4,800,000 |
| Electricity | $0.136 | $0.136 | $0.136 | $0.136 | $0.136 | $0.136 |
| Annual Production | 46,080 kWh | 115,200 kWh | 345,600 kWh | 576,000 kWh | 1,152,000 kWh | 2,304,000 kWh |
| Investment Horizon | 40 years | 40 years | 40 years | 40 years | 40 years | 40 years |
| LCOE | $0.113 | $0.092 | $0.079 | $0.075 | $0.071 | $0.070 |
| Payback | 18.5 years | 16.1 years | 14.5 years | 13.8 years | 13.3 | 13.0 years |
| Unleveraged IRR | 5.40% | 6.50% | 7.40% | 7.90% | 8.20% | 8.40% |
| Leveraged IRR after tax | 15.40% | 22.90% | 28.30% | 31.00% | 32.90% | 33.80% |
These figures are representative of high performance sites, pricing as of November 2020 and subject to change.
Electricity Rates and Inflation
Historical Pricing & Looking Forward: Solar Cost
Over the past 10 years, electricity prices have risen by an average of 7% per year. The Ontario Long Term Energy Plan, prepared by the IESO, calls for an average increase of 4% per year for the next 10 years.
Historical Electricity Pricing $/kWh
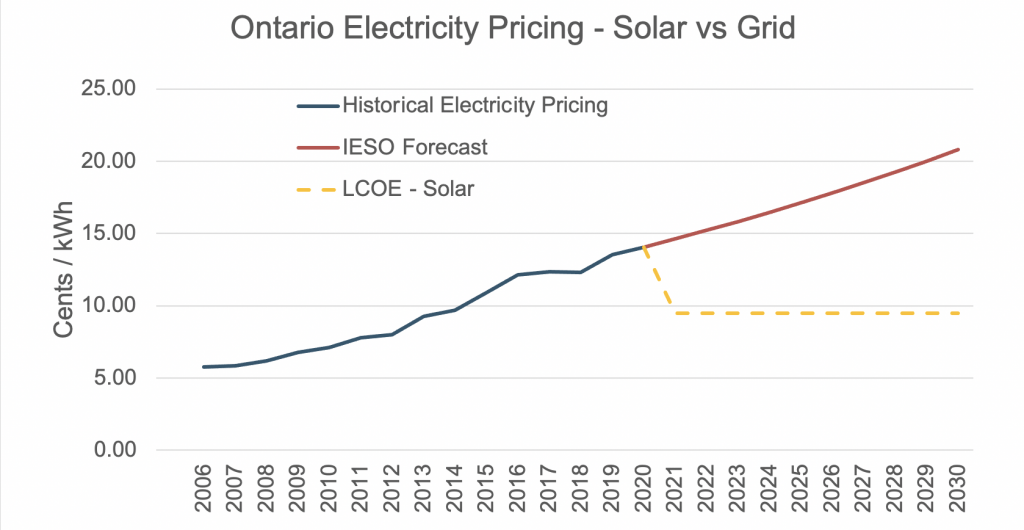
Sources: IESO, Ministry of Energy
Buying vs Renting Electricity
Paying an electricity bill month after month is like “renting” your electricity from the utility, and continues to increase in cost. When you purchase a solar PV system, you become your own utility and “lock in” your electricity costs at a fixed rate for the next 20-40 years.
Yearly Expenditures - Buy vs Rent
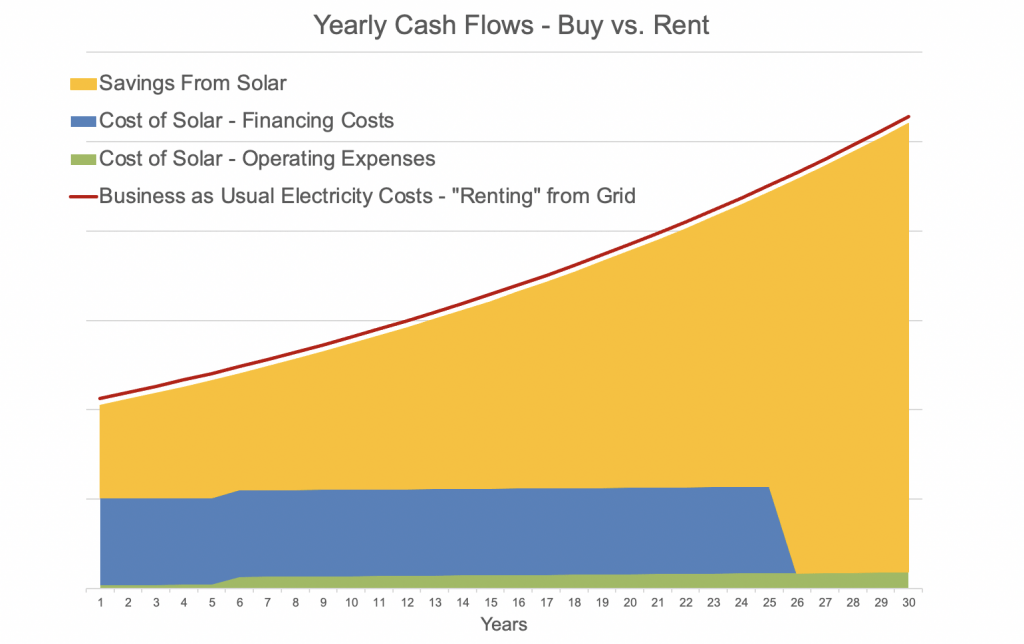
Buying solar
Pros
- Lower cost of electricity over life of system
- You own an asset that lasts 25-40+ years
- Yields a rate of return on your investment
- Reduces your environmental impact in a visible way, shows sustainability values
- Could provide some energy resiliency (ex. during blackouts) if battery storage is utilized
Cons
- Perhaps have site-specific production limitations
- Risk of system performance
"Renting" from grid
Pros
- No investment required
Cons
- Risk of ongoing increases in cost of energy provided by utility
- A significant portion of money spent on provincial grid electricity leaves the community (supply is outside of local region)
- No choice in selecting only clean, renewable energy, sources
- Never achieve self sufficiency
Glossary of terms and concepts - solar cost
Leverage: Borrowing a portion of the project costs. In these scenarios, borrowing 75% of costs, at 4.5% interest, amortizing over 25 years
Debt to Equity: The amount borrowed compared to invested capital
- 75% borrowed, 25% invested = 3:1 debt to equity
Debt Service Coverage Ratio: DSCR, the ration of earnings/cashflow to debt payments. Banks look for a minimum of 1.2 or higher.
Security: What a bank can hold as collateral for a loan.
- Mortgage security on the building
- Can now take solar assets as collateral
Accelerated Depreciation: Businesses typically “write off” or amortize equipment over the lifespan.
- Solar projects currently quality for 100% write off against income in year 1
- With a general income tax rate of 26.5%, a 25% investment gets all of the cash back in year 1.
Internal Rate of Return: Financial calculation assumes all free cash flow can be reinvested at a similar rate.
Payback: The number of years before the initial cash investment is fully recouped
Operating expenses: includes all operating costs (insurance, monitoring, maintenance).
Levelized cost of energy (LCOE): Takes all capital and operating expenses for the project and divides it by the kWhs produced by the system throughout its evaluation